
A real-time people counter,
without the clicker.
Live Capacity is people counting software without the cameras, the clicker or the clipboard. Guests scan a QR code to enter and another to leave. Staff see live occupancy against the cap on any phone or tablet, across every zone. No sensors, no turnstiles, no install.
Built for skating rinks, fan zones, conference rooms, theme park attractions, brand activations, pop-ups and merch floors.
Beyond queue management
Queue management is for places where people wait.
Live Capacity is for places where people are inside.
“How long is the wait?”
- •Tracks position in line and estimated wait time
- •Built for restaurants, barbers, clinics: service-throughput businesses
- •No concept of an exit. Staff calls next, customer leaves silently.
- •Fits venues without a hard cap on simultaneous occupancy.
“How many are inside right now?”
- Tracks live occupancy against your cap, party size included
- Built for venues, events, parks, conferences: capacity-bound spaces
- Exit-QR for guests, search-by-name for staff, auto-timeout safety net
- Shows the door under, near and at cap so staff know when to pause
People counting without the cameras
Most people counter software is a camera project.
Search for people counter software or a footfall counter and you get three kinds of product. All three produce a count. None of them puts that count in front of the door team against your cap.
Door tallies and IR beams
Clicker apps and beam counters you buy and mount at the door. They count entries. Nobody knows who is inside now or when they left.
CCTV and 3D sensor software
People counting bolted onto cameras. Accurate footfall and dwell analytics after a hardware install, and still an anonymous number the door cannot act on.
Workplace occupancy sensors
Ceiling sensors for desks and meeting rooms. Built for office utilisation reports, not a pop-up floor that opens on Friday and closes on Sunday.
Live Capacity is occupancy monitoring for venues, pop-ups and merch floors. A live headcount of who is inside, in and out counting by QR with party size included, and a cap the door team can see on any phone. The install is two printed posters.
Built for capacity-bound venues
If your venue has a cap, Live Capacity is for you.
Wherever overcrowding is the failure mode, for safety, for sponsor obligations or for the guest experience, Live Capacity gives you the controls and the data.
Skating rinks & courts
Open-skate sessions, ice rinks, indoor courts, climbing gyms: capacity-bound, recurring sessions where overcrowding ruins the experience and the insurance.
Theme parks & attractions
Rides with cars-per-cycle limits, walk-through experience zones, character meet-and-greets. Ops see the live count against the cap and know when to admit the next group and when to hold.
Fan zones & VIP areas
Stadium fan zones, beer gardens, suite-level VIP, sponsor activations. Clear occupancy targets, high-volume churn, sponsor reporting on attendance and dwell time.
Conferences & expos
Breakout rooms with occupancy limits, keynote halls that fill fast, exhibitor booths. One dashboard tracks every zone for the ops lead.
Museums & galleries
Timed-entry exhibits, special-collection rooms, traveling shows. Replace clipboard counts with live occupancy and per-visitor dwell-time analytics.
Festivals & outdoor events
Fenced viewing platforms, artist meet-and-greet zones, food court overflow. Tight occupancy limits on space-constrained sub-zones at otherwise open-attendance events.
Brand activations, pop-ups & merch floors
Mall and street activations, pop-up shops and merch floors with a limited footprint. Live people counting on the floor, not a footfall report after closing, plus the attendance data sponsors ask for.
Lounges, clubs, casinos
Member-only floors, lounges within a larger venue, rooms that fill on a good night. Live count + audit trail your ops team can reconcile after the fact.
How it works
Two QR codes. One dashboard. No install.
Print + post the QR codes
One QR poster at the entrance. One at each exit. Customise the heading and subhead in the settings page, print, and post. That is the install.
Guests scan to enter and leave
Guests scan the entry QR, fill a short form, and join the live queue. When they leave, they scan an exit QR. The page already knows who they are. No form refill, no friction.
Staff sees occupancy live
Real-time dashboard shows who is inside right now, who is waiting to be admitted, and who has just been checked in. Multi-user, multi-device, sub-second sync.
The real product
What the door team and the guest actually see.
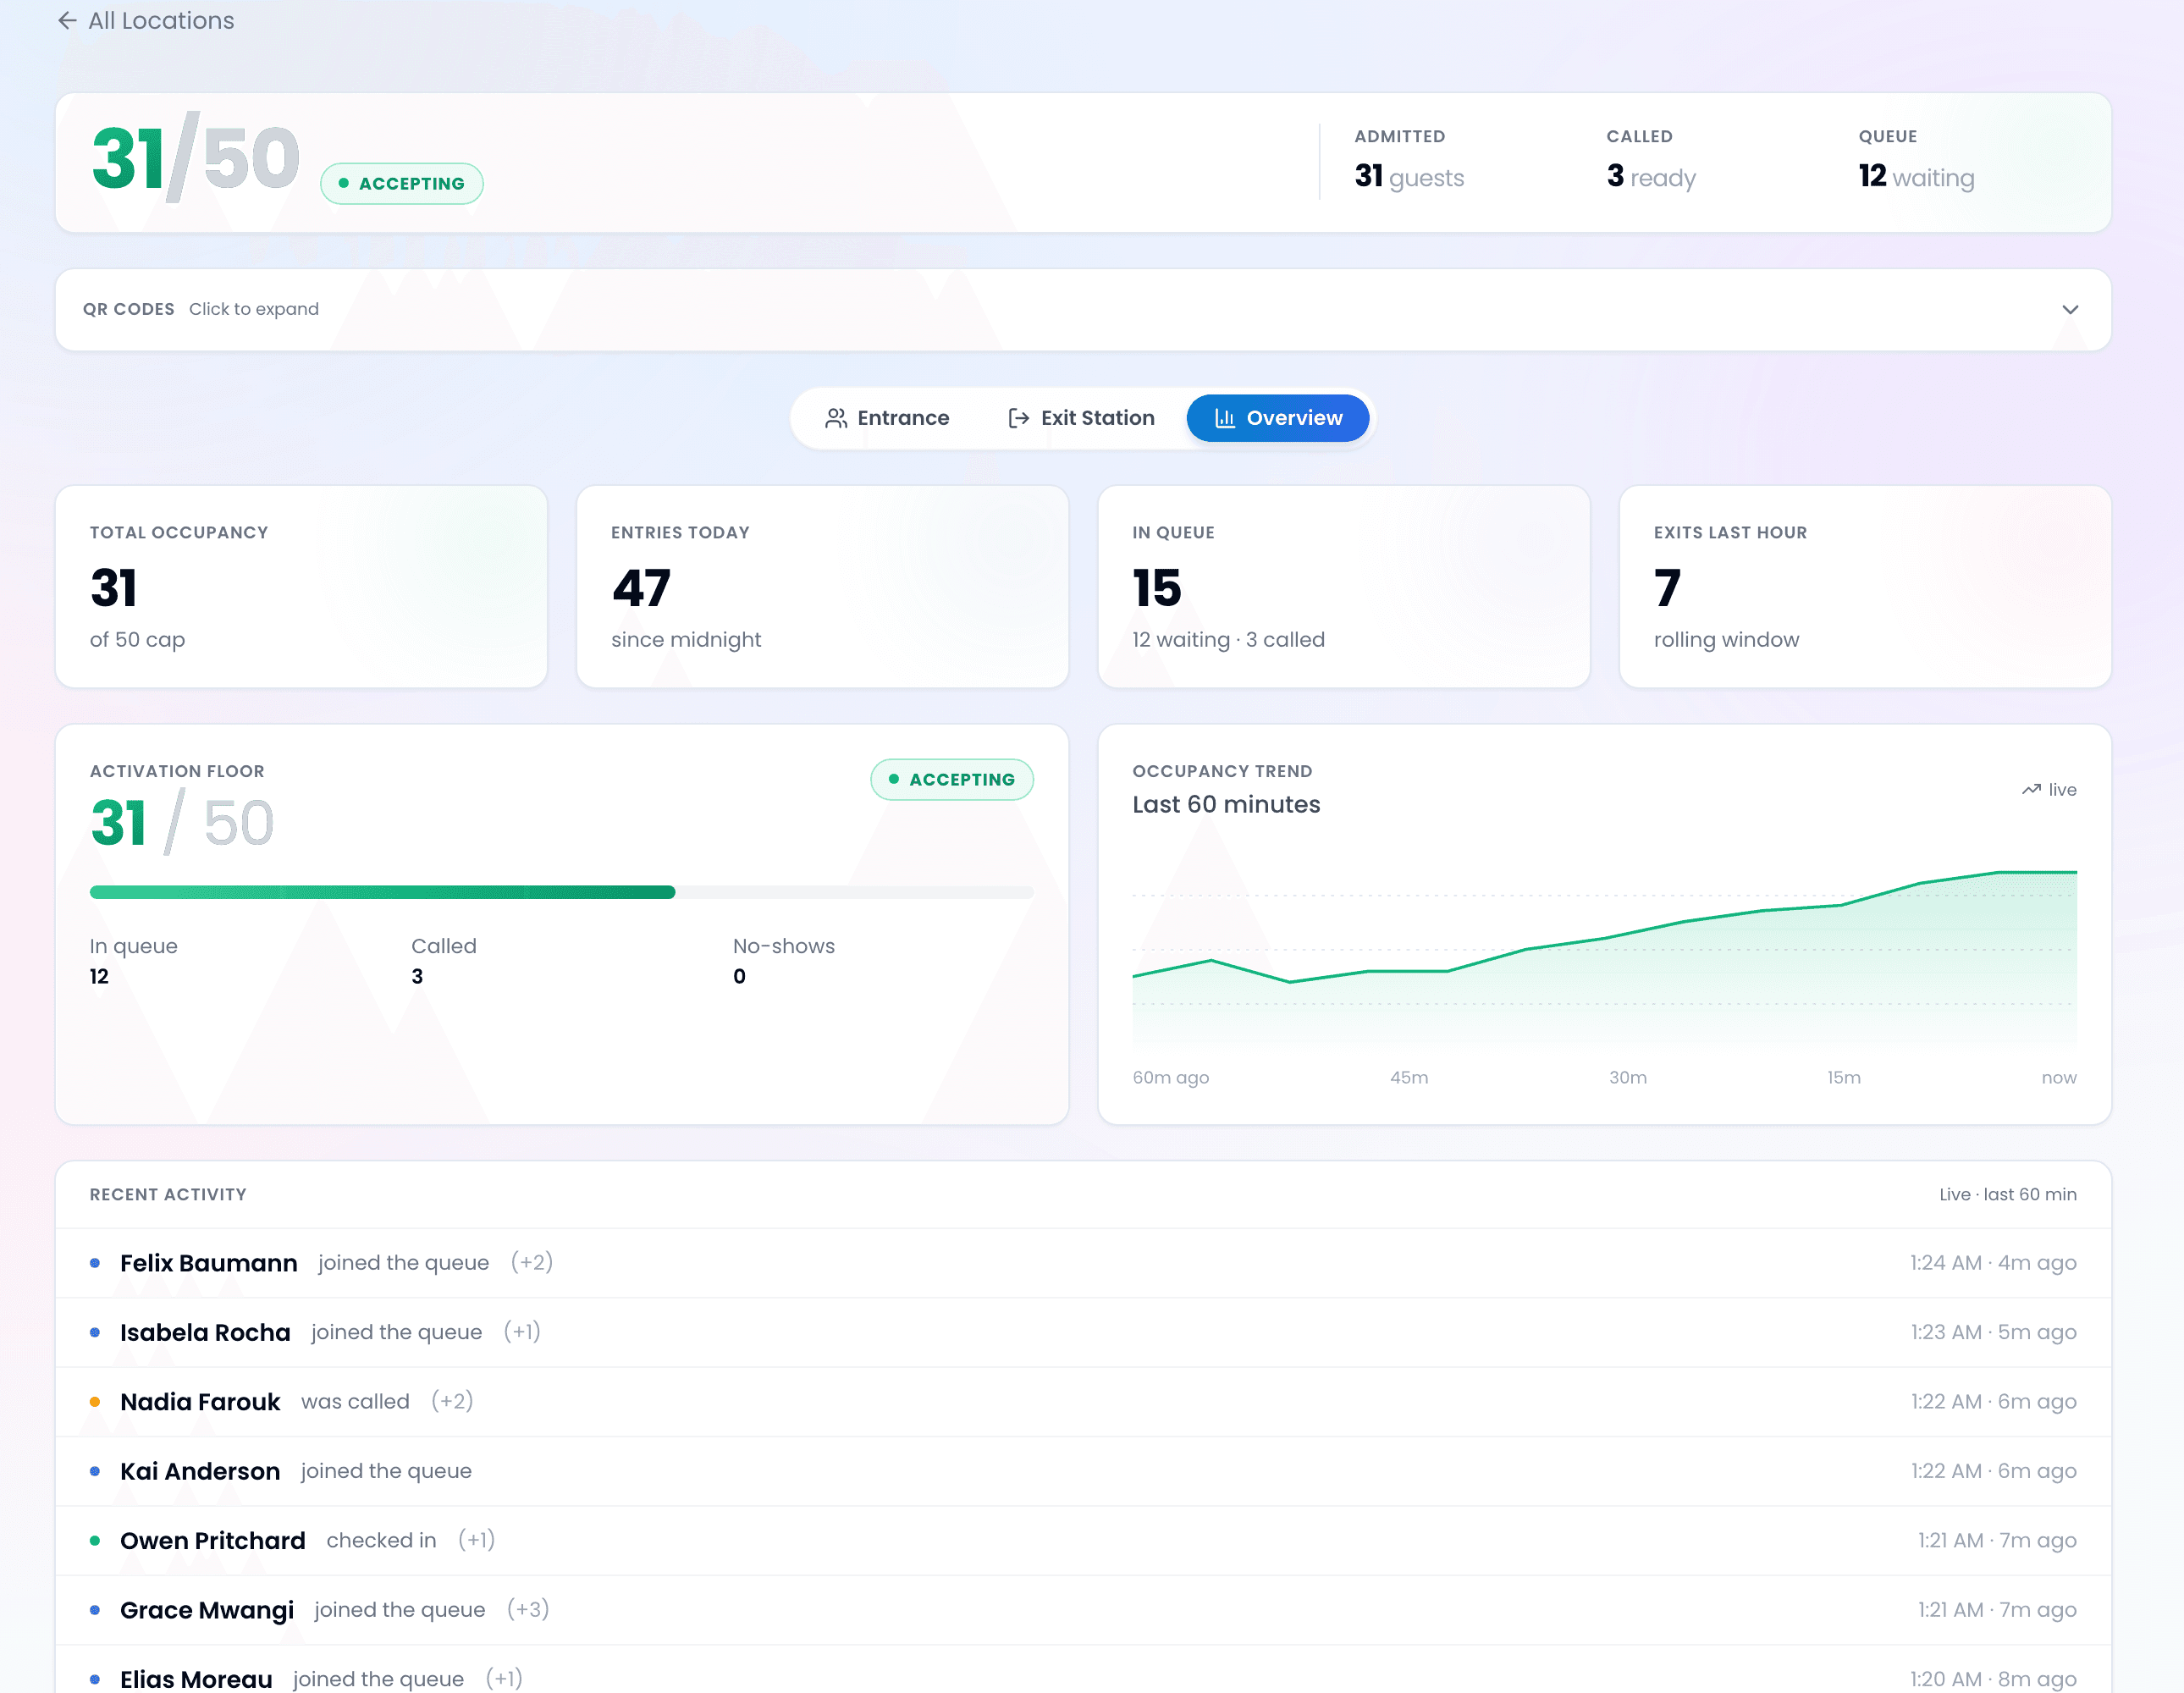
These are screenshots of the live dashboard and the guest ticket, not illustrations. The venue is a 50-person activation floor.
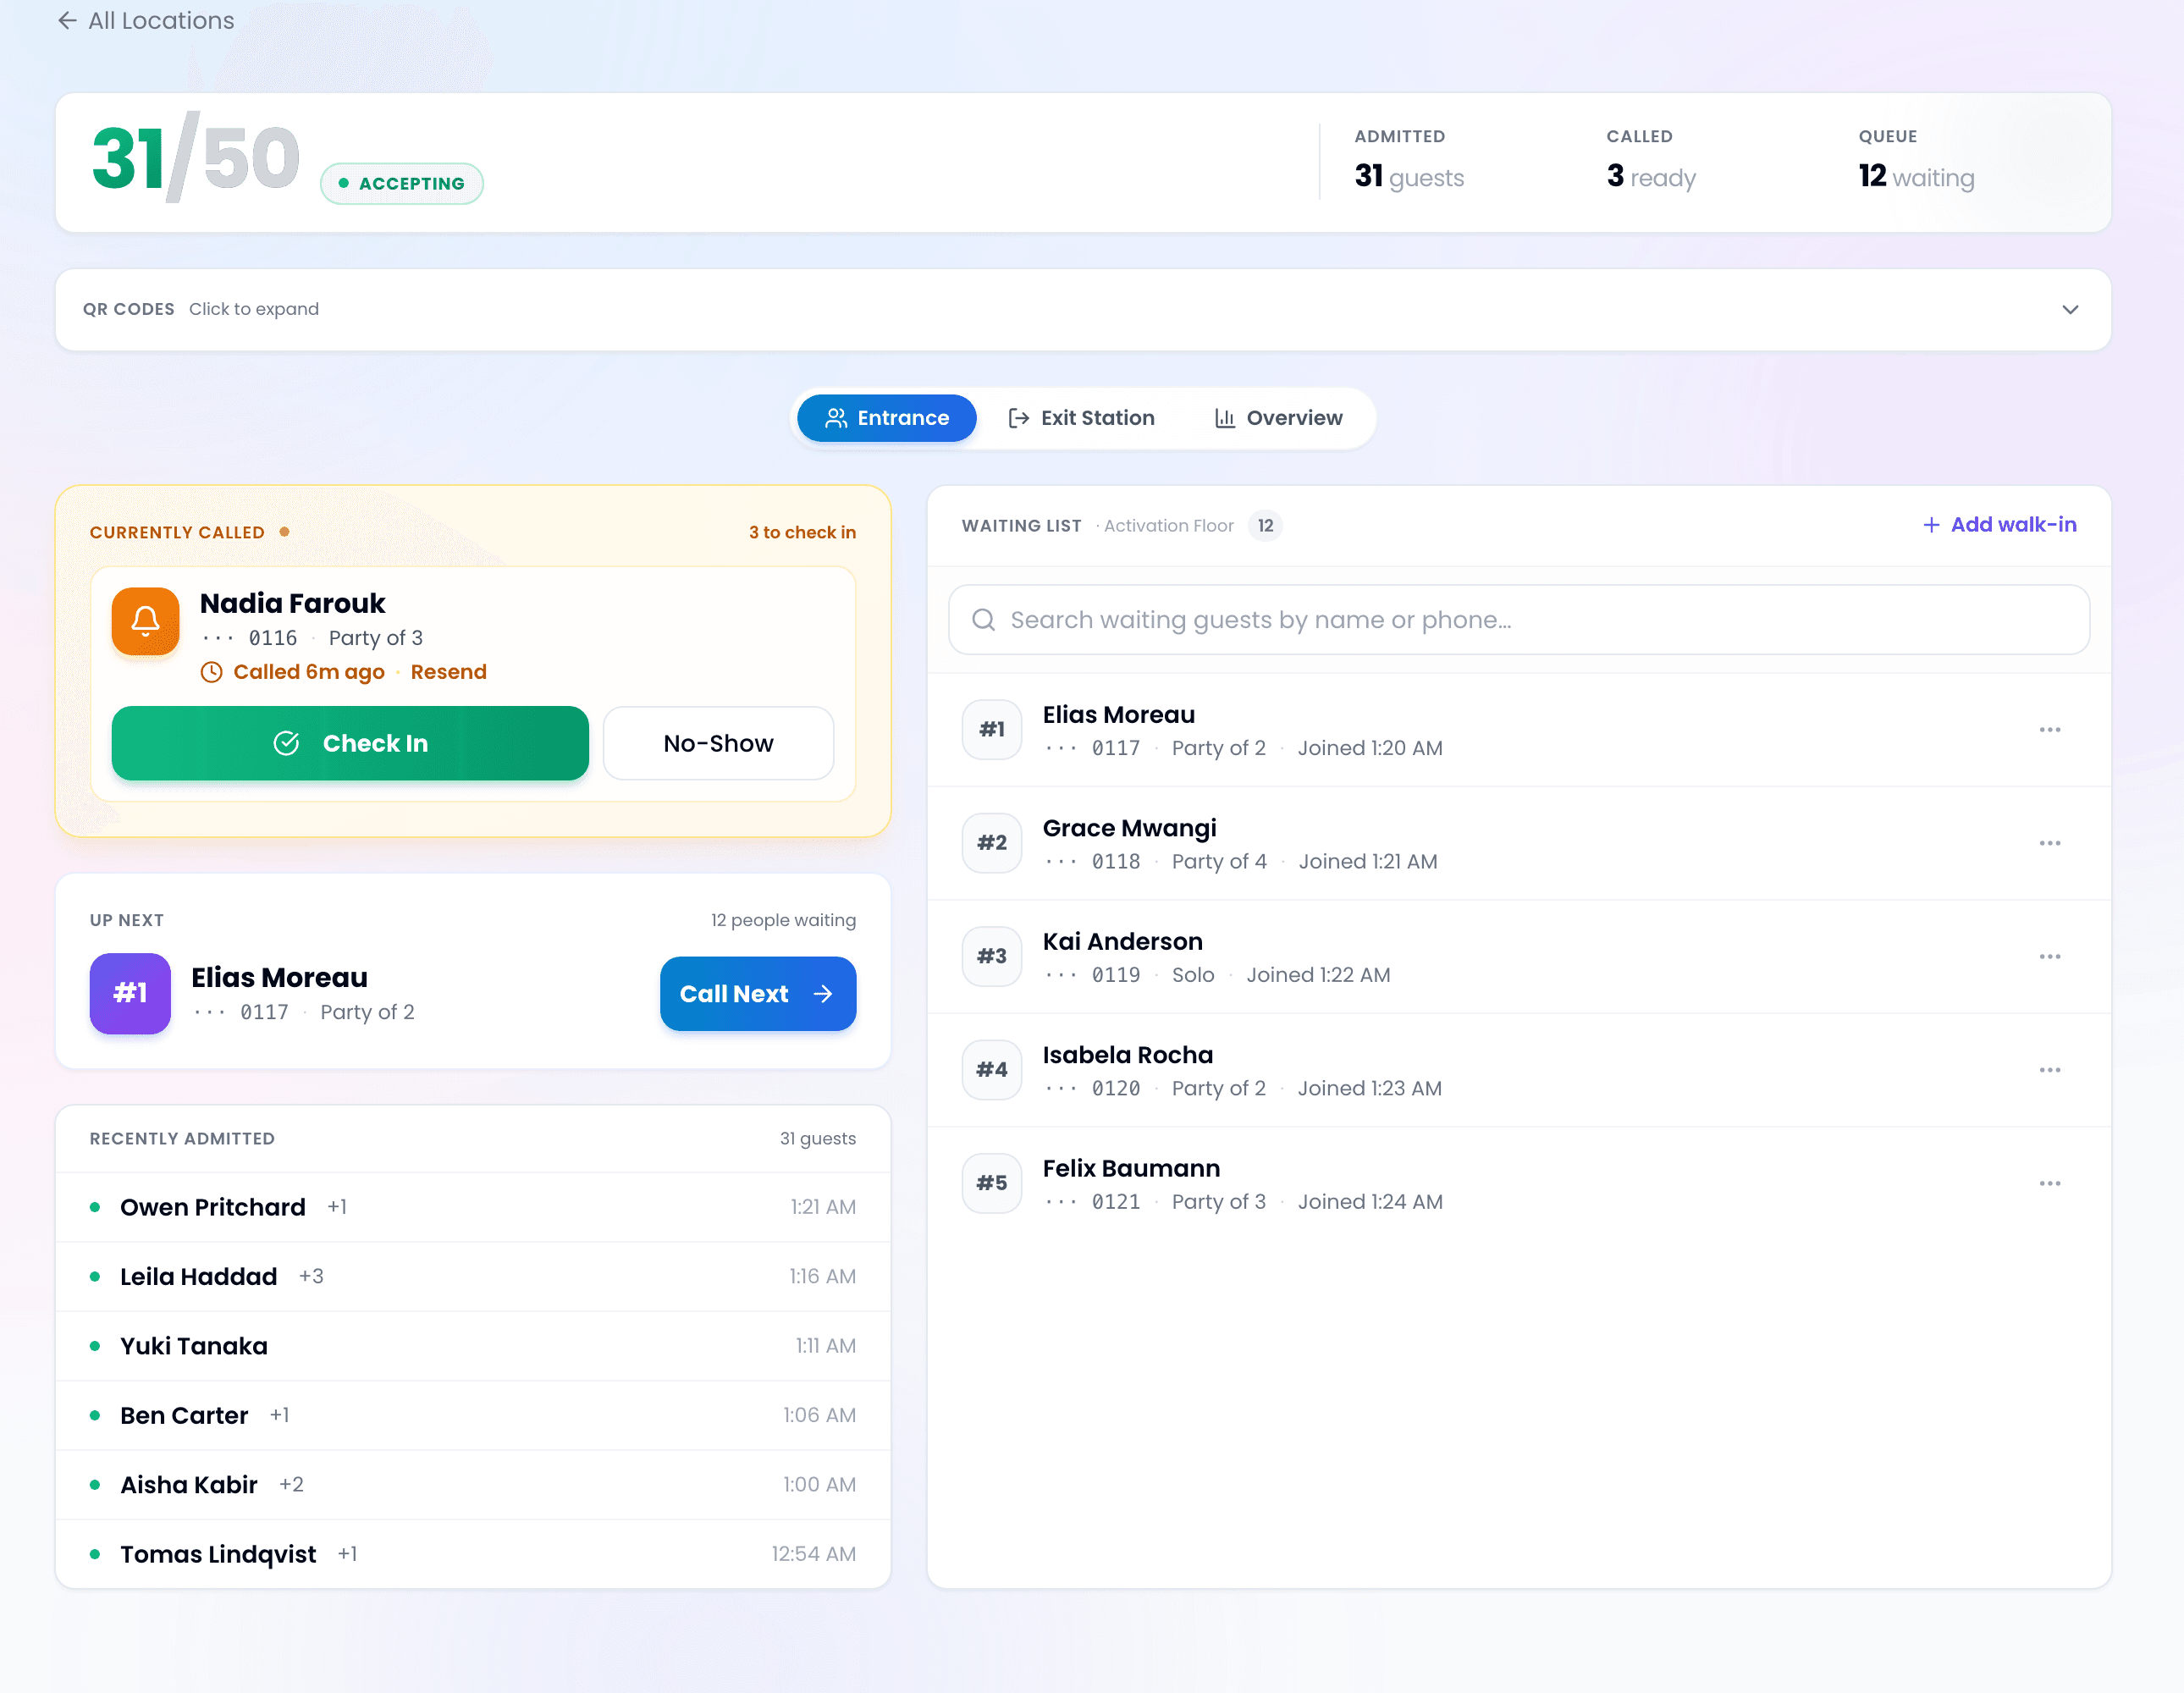
Entrance view. The count at the top is the only number the door needs. Call the next group, check them in when they reach the door, mark a no-show if they never turn up. Party size is counted, so a group of four moves the count by four.
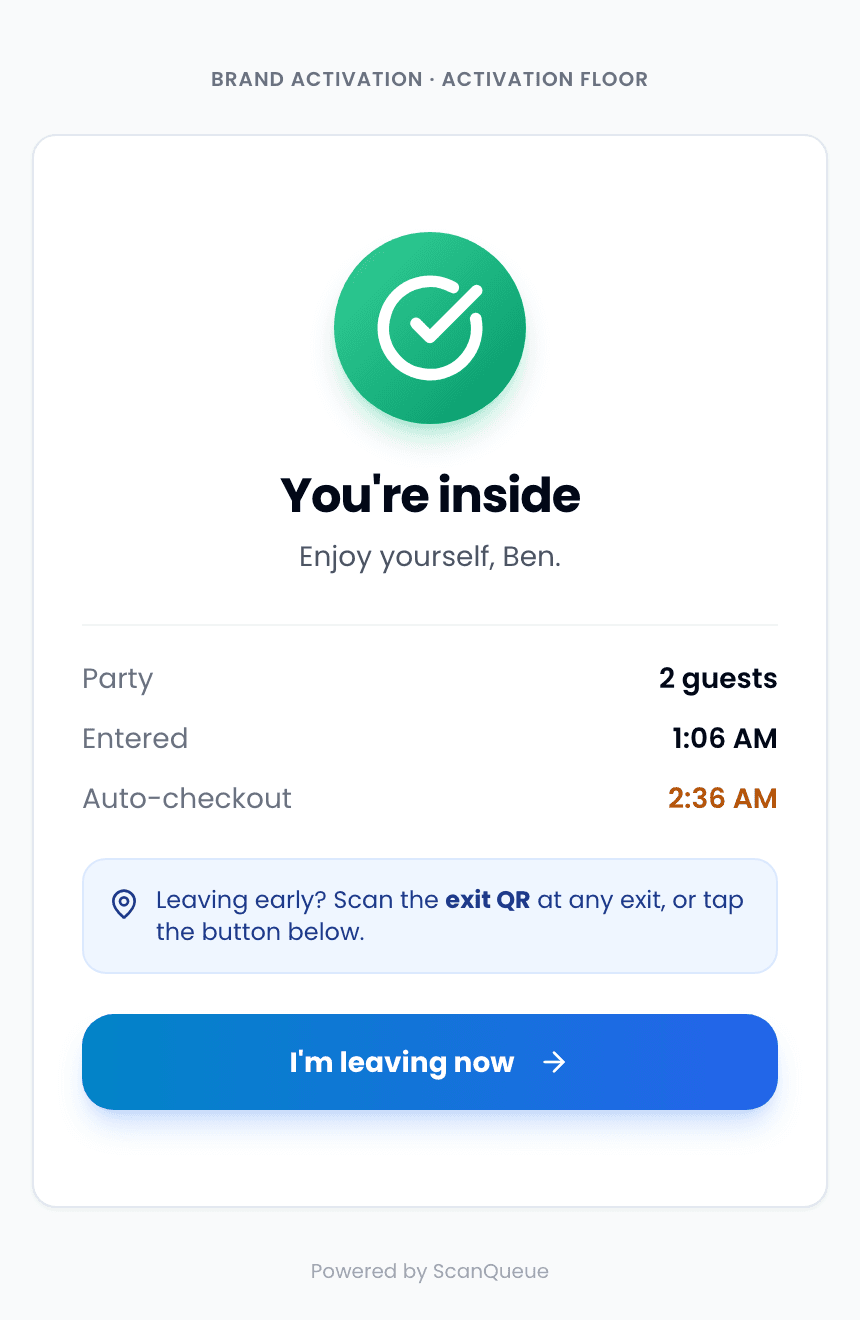
Guest phone. No app. After check-in the ticket shows they are inside, when they came in, and when the auto-checkout will close the session if they leave without scanning the exit code.
Compare
How Live Capacity stacks up.
| Capability | Queue management tools | Turnstiles | Camera & sensor counters | Live Capacity |
|---|---|---|---|---|
| Real-time occupancy count | ||||
| Setup cost | Low | $20k to $50k per location | Hardware quote per site | Low |
| Hardware install | None | Required at every entrance/exit | Cameras or sensors at every entrance/exit | None |
| Multi-exit without per-exit staff | yes (with turnstile) | |||
| Per-guest identity preserved at exit | n/a | no (anonymous count) | no (anonymous count) | |
| Group exit in one tap | no (one-by-one) | n/a (anonymous count) | ||
| Sponsor-grade reporting (per-guest session) | limited | count only | footfall and dwell only | |
| Works with any browser, no app install | varies | n/a | vendor dashboard |
Features
Built for the realities of busy venues.
Live occupancy at a glance
A big traffic-light number tells staff at the door whether to admit the next guest or pause. Green under cap, amber near cap, red at cap.
Self-service exit via QR
Guests scan on the way out. The page remembers them via the ticket they joined with. One tap, no form, no staff bottleneck.
Search-by-name exit backstop
For guests who cannot or will not scan, staff finds them in the active occupancy list with two taps. Identity preserved end-to-end.
Group exits in one tap
A family of four leaves together. One staff confirm closes all four entries. No queuing at the exit while the system catches up.
Auto-timeout safety net
Forgotten exits clear themselves after a configurable session window. The live count stays honest even without perfect guest behaviour.
Per-guest session analytics
Length of stay, peak occupancy, throughput per hour, exit times, for post-event reports, sponsor decks, and operational tuning.
FAQ
Questions about counting people and managing capacity.
See it live with your venue's setup.
Book a 20-minute demo. We'll walk through your venue's cap, exit flow, and reporting needs. No deck, no sales script, just a live dashboard you can scan into from your phone. Or turn it on yourself: owners enable Live Capacity from Business Settings on any paid plan, or on the free plan within its daily limit.